
The Invisible Engine of Global Finance
There’s a strange mystique surrounding the Forex market. If you spend enough time scrolling online, you’d think it was a digital casino where twenty-somethings turn pocket change into supercars overnight. The reality is far less glamorous, significantly more complex, and infinitely more fascinating.
Forex, short for foreign exchange, is the largest financial market on earth. We’re talking about a staggering $7 trillion changing hands every single day. To put that in perspective, the New York Stock Exchange handles a fraction of that volume. But unlike the stock market, which has a physical bell that rings at 9:30 AM in Manhattan, Forex is completely decentralized. It’s an electronic network of banks, hedge funds, multinational corporations, and retail traders spanning the globe. Because it operates across every major time zone—from Sydney to Tokyo, London, and New York—the market is alive 24 hours a day, five days a week.
But what are you actually doing when you trade Forex? At its core, you are simply buying one currency while simultaneously selling another. You are speculating on the health and trajectory of entire national economies. When a European car manufacturer buys parts from Japan, they have to exchange Euros for Yen. When you travel to London, you swap Dollars for Pounds. These massive, constant global exchanges create fluctuations in the value of money, and where there is fluctuation, there is an opportunity to profit.
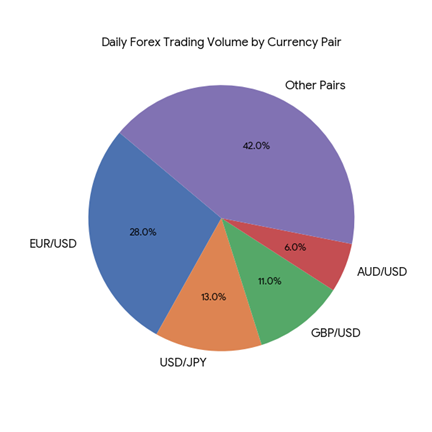
Figure 1: Distribution of global daily trading volume across major currency pairs.
Deconstructing Currency Pairs
You can’t just “buy a dollar.” The value of money is completely relative. A US Dollar is only worth something in comparison to what you can exchange it for—whether that’s a loaf of bread, a barrel of oil, or a Japanese Yen. Because of this, Forex is always traded in pairs.
Take the most heavily traded pair in the world: the Euro against the US Dollar (EUR/USD).
When you look at a pair, the first currency is the Base Currency (Euro), and the second is the Quote Currency (Dollar). The price you see on a chart tells you exactly how much of the quote currency it takes to buy one unit of the base currency. If the EUR/USD is sitting at 1.0850, it means one Euro costs one dollar and eighty-five and a half cents.
Trading this is conceptually simple. If you believe the European Central Bank is managing its economy better than the US Federal Reserve, you might anticipate the Euro getting stronger. You hit “Buy.” You are buying the Euro and selling the Dollar. If the price climbs to 1.0950, you’ve made a profit. If you think the US economy is heating up and the Euro is in trouble, you hit “Sell”—shorting the Euro to buy the Dollar.
The major pairs all include the US Dollar (EUR/USD, GBP/USD, USD/JPY). Then there are cross pairs, which skip the dollar entirely (like EUR/GBP or AUD/JPY), and exotic pairs, which match a major currency against a developing economy’s currency (like USD/ZAR for the South African Rand). Most beginners stick to the majors because they offer the most stability, the highest volume, and the lowest fees.
The Language of the Trade: Pips, Lots, and Spreads
To understand how money is actually made (and lost), you need to learn the native language of the market. You won’t hear traders talking about making “five dollars” on a trade. They talk in pips.
A pip, or Percentage in Point, is the smallest standard unit of measurement in Forex. For most pairs, it’s the fourth decimal place. If the EUR/USD moves from 1.0850 to 1.0851, that is a one-pip move. It’s a microscopic fraction of a penny. (Note: For pairs involving the Japanese Yen, the pip is the second decimal place).
Because these price movements are so tiny, trading small amounts of money would yield literally fractions of a cent in profit. To make it worthwhile, currencies are traded in standardized batches called Lots.
– A Standard Lot is 100,000 units of currency.
– A Mini Lot is 10,000 units.
– A Micro Lot is 1,000 units.
If you are trading a standard lot of EUR/USD, a single pip movement is worth exactly $10. Suddenly, a 50-pip change in price—something that happens almost every day—means a profit or loss of $500.
Then there is the spread. Brokers don’t typically charge flat commission fees. Instead, they make their money on the spread: the tiny difference between the buy (ask) price and the sell (bid) price. The moment you enter a trade, you are slightly in the red because you have to cross this spread to reach profitability. It’s the cost of doing business in the market.
Leverage: The Double-Edged Sword
Here is the part where most beginners ruin their lives. How do regular people afford to trade $100,000 standard lots? The answer is leverage, essentially a line of credit extended by the broker.
Leverage allows you to control a massive position with a tiny deposit, known as margin. In the US, brokers offer up to 50:1 leverage. In other parts of the world, it can go up to 500:1.
Let’s say you have 100:1 leverage. To trade a $100,000 standard lot, you only need to put up $1,000 of your own money.
When you are right, leverage feels incredible. A 1% move in the market could double your $1,000 account in a matter of hours. But here is the brutal, unforgiving truth: leverage magnifies losses exactly as aggressively as it magnifies gains. If the market turns against you by just 1%, your entire $1,000 deposit is wiped out. You will hit a margin call, and the broker will automatically close your trade to prevent you from losing money you don’t actually have.
This is why risk management isn’t just a buzzword; it is the fundamental difference between trading and gambling.
Two Ways to Read the Market: Technical vs Fundamental
So, how do you decide when to buy or sell? Traders generally fall into two camps: Technical Analysts and Fundamental Analysts.
Technical Traders couldn’t care less about the news. They believe that everything you need to know—fear, greed, supply, demand, world events—is already reflected in the price chart. They study historical price action, drawing trend lines and identifying repeating geometric patterns like ‘head and shoulders’ or ‘double bottoms’. They use mathematical indicators, like Moving Averages or the Relative Strength Index (RSI), to spot when a currency is overbought or oversold. To them, the chart is a living psychological map of market participants.
Fundamental Traders, on the other hand, are obsessed with the ‘why’. They study the massive macroeconomic gears turning behind the scenes. They track Central Bank decisions. If the US Federal Reserve raises interest rates, foreign investors will buy the Dollar to get higher returns, driving the price up. Fundamental traders keep a close eye on the economic calendar. They know that on the first Friday of every month, the US releases its Non-Farm Payrolls (NFP) report. If the US added way more jobs than expected, it’s a sign of a roaring economy, and the Dollar will surge. If unemployment spikes, the Dollar will drop.
The best traders usually combine both. They use fundamental analysis to decide what to trade, and technical analysis to decide exactly when to enter the trade.
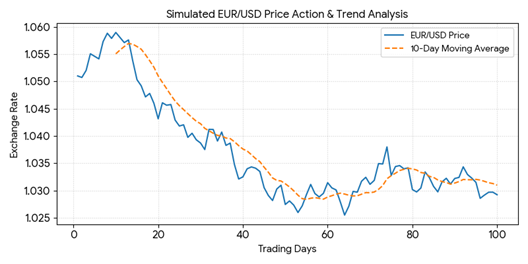
Figure 2: Simulated price action and moving average trend on a standard trading chart.
The Psychology of Trading
You can have the best strategy in the world, perfectly executed on a demo account, but the moment you put real money on the line, everything changes. Trading psychology is the hardest obstacle to overcome.
The market has a way of ruthlessly exploiting human emotion. When a trade starts going against a beginner, they often refuse to close it, hoping it will turn around. This is driven by ego—the inability to admit they were wrong. By the time they finally capitulate, a small loss has become a massive one. Conversely, when a trade is in profit, beginners often panic and close it too early, terrified the market will take their money back. They cut their winners short and let their losers run.
Then there is revenge trading. After taking a frustrating loss, a trader will immediately jump back into the market with a larger position size, aggressively trying to win the money back. This almost always leads to a blown account.
The Cold Hard Reality of Retail Trading
If you want to survive in this arena, you have to realize who you are playing against. You are competing with institutional trading algorithms run by Wall Street banks with billions of dollars and lightning-fast information networks.
So how do retail traders succeed? They don’t try to outsmart the market; they manage their risk meticulously. A professional trader doesn’t care if they are right or wrong on one specific trade. They know it’s a game of probabilities. If a trader only risks 1% of their account balance per trade, and aims for a 2% or 3% return when they win, they can actually lose half of their trades and still be highly profitable over a month.
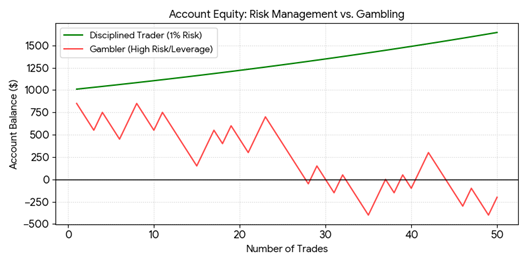
Figure 3: Account equity simulation comparing a disciplined risk manager to a high-leverage gambler.
The traders who blow their accounts aren’t necessarily bad at reading charts; they are bad at managing their emotions and managing their capital.
If you are serious about learning Forex, forget the flashy lifestyle marketing. Treat it like a profession. Open a demo account with fake money. Trade it for six months. Learn how to read price action, understand macroeconomic drivers, and most importantly, learn how to lose gracefully.
The Forex market is a phenomenal vehicle for financial independence. It offers you the ability to work from anywhere in the world and profit in both rising and falling economies. But it demands respect, relentless discipline, and a deep understanding of exactly what you are doing before you ever risk a single real dollar.